ARPSN Recorded Earthquake Collection
2009
Although there are many, constant, Seismic events; the following collection caught my 'amateur' attention, and are presented for observation & consideration:
Magnitude 7.6 - NEAR THE NORTH COAST OF PAPUA, INDONESIA
2009 January 03 19:43:54 UTC

Above Image Recorded by ARPSN in Northern California - large image - USGS Event ID - us2009bjbn
Dream Catcher
Long ago in the ancient world of the Ojibwe Nation, the Clans were all located in one general area of that place known as Turtle Island. This is the way that the old Ojibwe storytellers say how Asibikaashi (Spider Woman) helped Wanabozhoo bring giizis (sun) back to the people. [Continue]
Something I Find Interesting Nobody Is Talking About:

Recent Seismic Activity at Yellowstone National Park, Wyoming.
WHAT, WHERE, and WHY Interesting?
Because Yellowstone is one of the largest SUPER VOLCANOES on the planet.
December 27, 2008
[Note: Magnitude listed in Blue]
MAP 3.3 2008/12/27 22:30:04 44.498 -110.358 4.3 YELLOWSTONE NATIONAL PARK, WYOMING
MAP 3.2 2008/12/27 20:26:28 44.505 -110.364 2.4 YELLOWSTONE NATIONAL PARK, WYOMING
MAP 3.5 2008/12/27 20:17:33 44.488 -110.357 4.1 YELLOWSTONE NATIONAL PARK, WYOMING
MAP 3.0 2008/12/27 18:23:07 44.495 -110.364 2.8 YELLOWSTONE NATIONAL PARK, WYOMING
MAP 2.7 2008/12/27 17:01:08 44.490 -110.366 1.2 YELLOWSTONE NATIONAL PARK, WYOMING
MAP 2.6 2008/12/27 16:30:54 44.498 -110.362 2.5 YELLOWSTONE NATIONAL PARK, WYOMING
December 28, 2008
MAP 2.6 2008/12/28 23:57:57 44.521 -110.371 1.4 YELLOWSTONE NATIONAL PARK, WYOMING
MAP 3.1 2008/12/28 19:55:18 44.511 -110.353 0.7 YELLOWSTONE NATIONAL PARK, WYOMING
MAP 3.0 2008/12/28 19:32:16 44.511 -110.356 2.7 YELLOWSTONE NATIONAL PARK, WYOMING
MAP 2.8 2008/12/28 15:37:41 44.514 -110.359 0.0 YELLOWSTONE NATIONAL PARK, WYOMING
MAP 3.2 2008/12/28 09:23:58 44.511 -110.361 0.4 YELLOWSTONE NATIONAL PARK, WYOMING
MAP 2.7 2008/12/28 09:16:58 44.510 -110.358 2.6 YELLOWSTONE NATIONAL PARK, WYOMING
MAP 2.5 2008/12/28 07:15:19 44.495 -110.359 0.0 YELLOWSTONE NATIONAL PARK, WYOMING
MAP 2.5 2008/12/28 06:37:42 44.492 -110.356 2.6 YELLOWSTONE NATIONAL PARK, WYOMING
MAP 2.8 2008/12/28 05:23:54 44.489 -110.354 2.5 YELLOWSTONE NATIONAL PARK, WYOMING
MAP 3.9 2008/12/28 05:15:56 44.502 -110.366 0.3 YELLOWSTONE NATIONAL PARK, WYOMING
MAP 2.7 2008/12/28 04:51:04 44.501 -110.355 2.3 YELLOWSTONE NATIONAL PARK, WYOMING
MAP 2.6 2008/12/28 00:08:51 44.493 -110.354 0.4 YELLOWSTONE NATIONAL PARK, WYOMING
December 29, 2008
MAP 2.9 2008/12/29 20:38:25 44.514 -110.381 2.1 YELLOWSTONE NATIONAL PARK, WYOMING
MAP 2.9 2008/12/29 19:29:39 44.513 -110.381 0.5 YELLOWSTONE NATIONAL PARK, WYOMING
MAP 2.5 2008/12/29 19:28:56 44.515 -110.381 0.0 YELLOWSTONE NATIONAL PARK, WYOMING
MAP 3.3 2008/12/29 19:14:49 44.521 -110.369 1.8 YELLOWSTONE NATIONAL PARK, WYOMING
MAP 2.8 2008/12/29 04:25:54 44.514 -110.370 0.1 YELLOWSTONE NATIONAL PARK, WYOMING
December 30, 2008
MAP 2.8 2008/12/30 19:05:13 44.540 -110.350 0.1 YELLOWSTONE NATIONAL PARK, WYOMING
MAP 2.8 2008/12/30 11:59:07 44.533 -110.374 0.9 YELLOWSTONE NATIONAL PARK, WYOMING
MAP 2.8 2008/12/30 00:36:40 44.525 -110.362 1.2 YELLOWSTONE NATIONAL PARK, WYOMING
December 31, 2008
MAP 3.3 2008/12/31 15:02:12 44.523 -110.361 4.9 YELLOWSTONE NATIONAL PARK, WYOMING
MAP 2.7 2008/12/31 11:15:45 44.522 -110.372 1.2 YELLOWSTONE NATIONAL PARK, WYOMING
MAP 2.6 2008/12/31 09:05:59 44.520 -110.368 0.5 YELLOWSTONE NATIONAL PARK, WYOMING
MAP 3.6 2008/12/31 09:02:29 44.525 -110.362 4.3 YELLOWSTONE NATIONAL PARK, WYOMING
MAP 2.5 2008/12/31 08:59:22 44.522 -110.362 0.5 YELLOWSTONE NATIONAL PARK, WYOMING
MAP 3.0 2008/12/31 08:58:12 44.527 -110.369 1.3 YELLOWSTONE NATIONAL PARK, WYOMING
MAP 2.5 2008/12/31 05:17:42 44.530 -110.375 1.1 YELLOWSTONE NATIONAL PARK, WYOMING
MAP 2.8 2008/12/31 05:06:40 44.529 -110.382 1.6 YELLOWSTONE NATIONAL PARK, WYOMING
January 01. 2009
MAP 2.7 2009/01/01 12:51:25 44.548 -110.361 0.2 YELLOWSTONE NATIONAL PARK, WYOMING
MAP 2.8 2009/01/01 10:13:52 44.527 -110.353 2.0 YELLOWSTONE NATIONAL PARK, WYOMING
MAP 2.6 2009/01/01 10:13:01 44.527 -110.356 0.0 YELLOWSTONE NATIONAL PARK, WYOMING
MAP 2.6 2009/01/01 10:06:51 44.527 -110.377 0.5 YELLOWSTONE NATIONAL PARK, WYOMING
MAP 2.9 2009/01/01 10:02:58 44.530 -110.357 2.0 YELLOWSTONE NATIONAL PARK, WYOMING
MAP 2.5 2009/01/01 05:19:51 44.529 -110.357 0.4 YELLOWSTONE NATIONAL PARK, WYOMING
January 02, 2009
MAP 2.6 2009/01/02 01:21:20 44.568 -110.367 0.1 YELLOWSTONE NATIONAL PARK, WYOMING
MAP 2.5 2009/01/02 01:13:06 44.551 -110.364 0.1 YELLOWSTONE NATIONAL PARK, WYOMING
Source: http://earthquake.usgs.gov/eqcenter/recenteqsww/Quakes/quakes_all.php
Wait a minute, Somebody Was Talking About It:
 to the southwest. This area of maximum uplift encompasses both Yellowstone's resurgent domes, features long known for similar movements. During this time period, the north-rim uplift anomaly subsided (bullseye in the upper left part of the interferogram). The yellow lines are roads. The yellow triangles are locations of GPS stations with continuous data. The light blue lake within the caldera is Yellowstone Lake. Thin black lines are mapped faults. Figure courtesy of C. Wicks, USGS.")
YELLOWSTONE VOLCANO OBSERVATORY MONTHLY UPDATE
Thursday, January 1, 2009 07:57 MST (Thursday, January 1, 2009 14:57 UTC)
Yellowstone Volcano Observatory: http://volcanoes.usgs.gov/yvo/
YELLOWSTONE VOLCANO (CAVW#1205-01-)
44.43°N 110.67°W, Summit Elevation 9203 ft (2805 m)
Volcano Alert Level: NORMAL
Aviation Color Code: GREEN
December 2008 Yellowstone Earthquake And Ground Deformation Summary
Earthquake Summary:
Yellowstone seismicity increased significantly in December 2008 due to an energetic earthquake swarm that commenced on December 26. This swarm, a sequence of earthquakes clustered in space and time, is occurring beneath the northern part of Yellowstone Lake in Yellowstone National Park. As of this writing, the largest of these earthquakes was a magnitude 3.9 at 10:15 pm MST on Dec. 27. Through 5:00 pm MST on Dec. 31, the sequence had included 12 events of magnitude 3.0 to 3.9 and approximately 20 of magnitude 2.5 to 2.9, with a total of at least 400 events large enough to be located (magnitude ~1 or larger). National Park Service (NPS) employees and visitors have reported feeling the largest of these earthquakes in the area around Yellowstone Lake and at Old Faithful and Grant Village.
The hypocenters of the swarm events cluster along a north-south-trending zone that is about 7 km long. The vast majority of the focal depths are shallower than 5 km. It is not possible to identify a causative fault of other feature without further analysis.
Analysts are currently processing the backlog of seismic data from these events. The current analyst-processed catalog is believed to include all events of magnitude 2.5 and greater through Dec 31 at 5 pm MST, but hundreds of earthquakes remain to be processed. The total of more than 400 locatable events is based on automatically-determined locations and magnitudes for the swarm events.
The December 2008 earthquake sequence is the most intense in this area for some years. No damage has been reported within Yellowstone National Park, nor would any be expected from earthquakes of this size. The swarm is in a region of historical earthquake activity and is close to areas of Yellowstone famous hydrothermal activity. Similar earthquake swarms have occurred in the past in Yellowstone without triggering steam explosions or volcanic activity. Nevertheless, there is some potential for hydrothermal explosions and earthquakes may continue or increase in magnitude. There is a much lower potential for related volcanic activity.
The National Park Service in Yellowstone has been kept fully informed of the ongoing seismic activity via electronic means and by phone contacts with the University of Utah and the U.S. Geological Survey USGS). The Wyoming Office of Homeland Security is reviewing Earthquake Response Plans and monitoring seismic activity.
Earthquakes are a common occurrence in the Yellowstone National Park area, an active volcanic-tectonic area averaging 1,000 to 2,000 earthquakes a year. Yellowstone's 10,000 geysers and hot springs are the result of this geologic activity. A summary of Yellowstone's volcanic history is available on the Yellowstone Volcano Observatory web site (listed below).
The University of Utah operates a seismic network in Yellowstone National Park in conjunction with the National Park Service and the U.S. Geological Survey. These three institutions are partners in the Yellowstone Volcano Observatory. Seismic data from Yellowstone are transmitted to the University in real-time by radio and satellite links from a network of 28 seismographs in the Yellowstone area and are available on the web.
Ground Deformation Summary:
Through December 2008, continuous GPS data show that much of the Yellowstone caldera continued moving upward, though at a lower rate than the past few years. The maximum measured ground uplift over the past 53 months is ~23 cm at the White Lake GPS station, north of Fishing Bridge. Yellowstone Volcano Observatory: http://volcanoes.usgs.gov/yvo/
Yellowstone Supervolcano: http://www.solcomhouse.com/yellowstone.htm
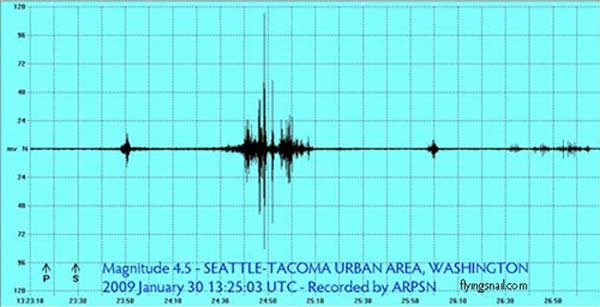
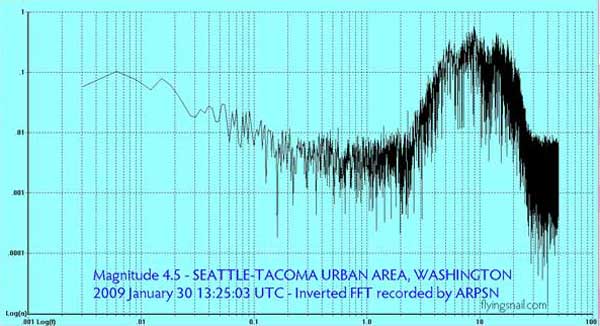
Magnitude 4.5 - SEATTLE-TACOMA URBAN AREA, WASHINGTON
2009 January 30 13:25:03 UTC (05:25:03 PST)
http://earthquake.usgs.gov/eqcenter/recenteqsww/Quakes/us2009clak.php
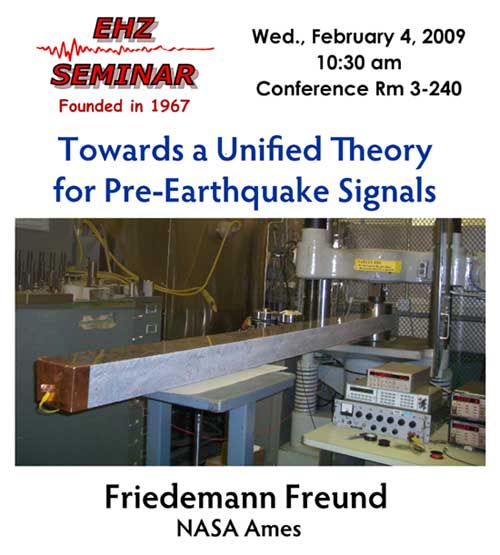
Towards a Unified Theory for Pre-Earthquake Signals
Speaker: Friedemann Freund, NASA Ames
Location: Building 3, Room 3240 (main USGS conference room)
Wednesday February 04, 2009 - 10:30 AM
http://earthquake.usgs.gov/regional/nca/seminars/
Magnitude 7.2 KEPULAUAN TALAUD, INDONESIA
recorded by ARPSN

Distance
(degrees) 104.16 Travel Time (min:secs) 13:59.7 Arrival Time UTC 17:48:51.7 Pdiff
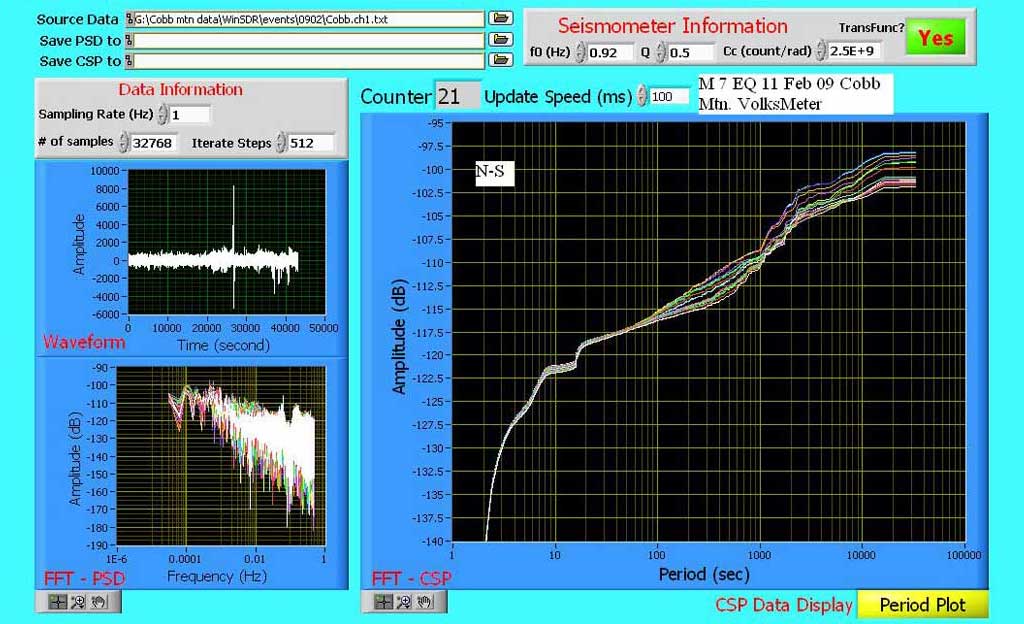
Cobb [Mountain], CA - N/S Mag. 7.2 Recorded by ARPSN - large image
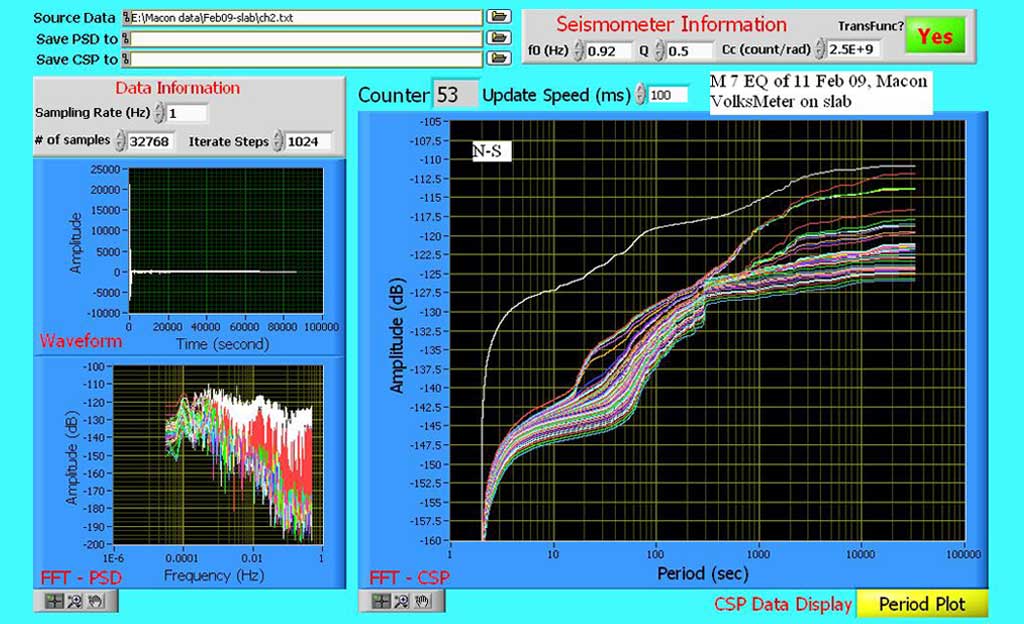
Macon, GA - Slab - N/S - Magnitude 7.2 - large image
Click to View Complete Page of Above Presentation
![FFT-CSP of First 10 days of February, Cobb [Mountain] Ca.](../images/1st-10daysFebE-W.jpg "FFT-CSP of First 10 days of February, Cobb [Mountain] Ca.")
CSP, 1st 10 days of February 2009, E-W channel, Cobb Mtn., CA - lagre image

February 22-25, 2009 - lagre image
The above video is a nice depiction of how the eigenmodes of a plate change with increasing forcing frequency. ARPSN Seismic FFT-CSP Comparison animations are currently painting an interesting picture.
 -
- 
Current extent and position of auroral oval at each pole. Click image to go to page.
 - Cobb, CA (red)")
Power Spectral Density February Averages Macon, GA (blue) - Cobb, CA (red)

February Comparison N/S CSP Averages - Macon, GA - Cobb, CA - Redwood City, CA
![Average of the Feb CSP curves for Cobb [Mountain] CA VolksMeter N-S channel](../images/CobbFebCSPavgN-S.jpg "Average of the Feb CSP curves for Cobb [Mountain] CA VolksMeter N-S channel")
Average Feb CSP Cobb Curves VolksMeter N-S Channel - large image
CSP, 1st 10 days of February 2009, E-W VolksMeter channel, Cobb Mtn., CA - large image
February 22-25, 2009 - Click for large image
Pondering FFT-CSP and Low Frequency
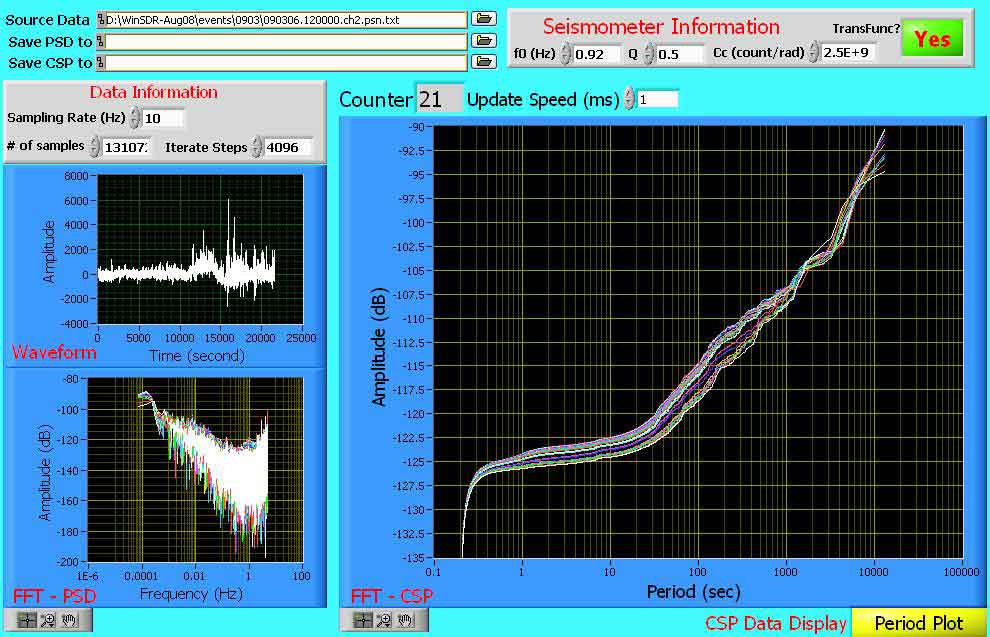
200903.06 Cobb [Mountain] FFT-CSP - Large Image
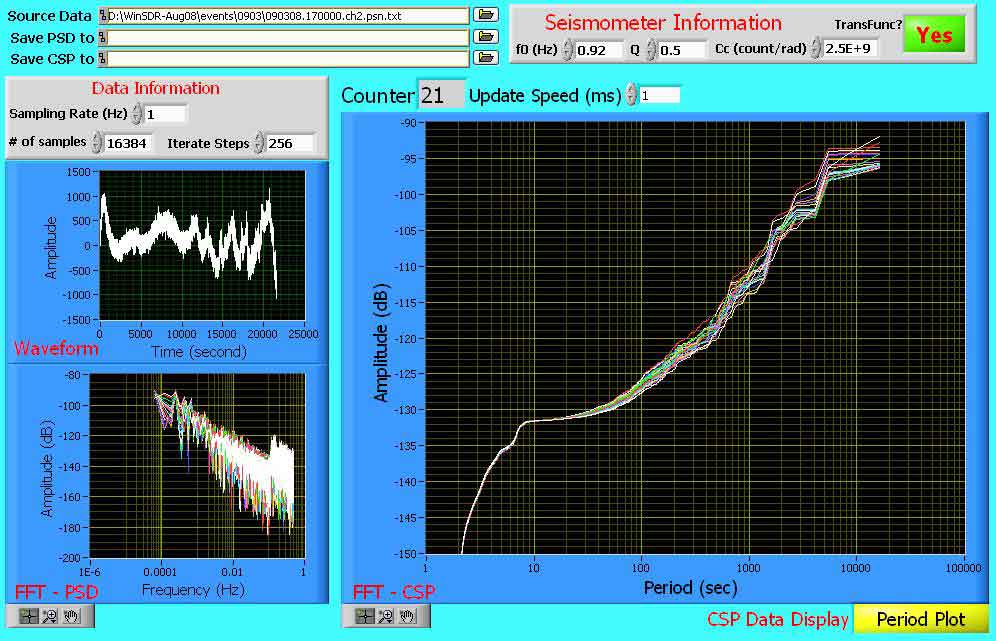
200903.08 Cobb [Mountain] FFT-CSP - Large Image
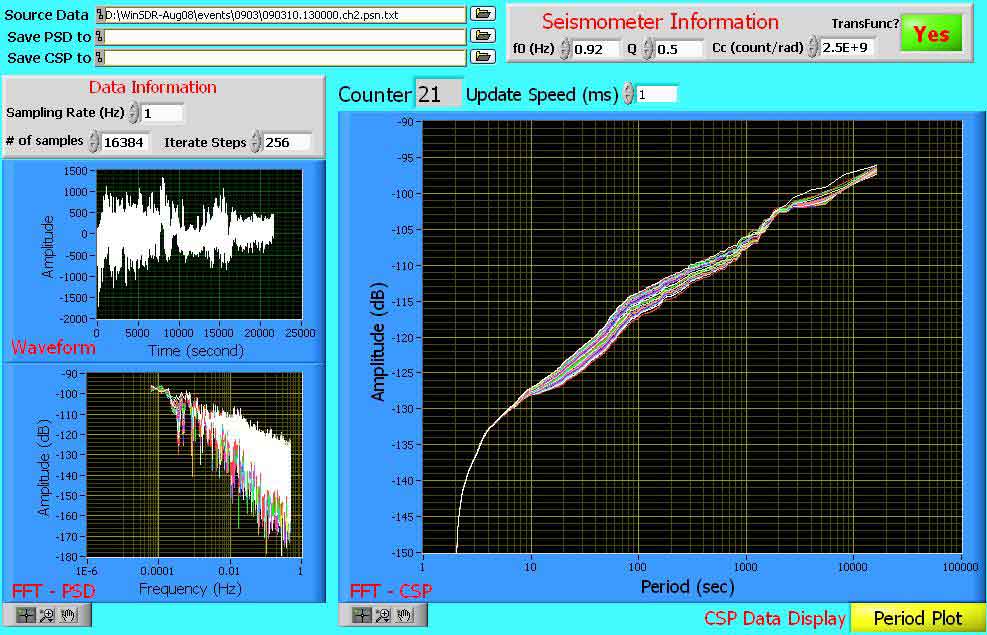
200903.10 Cobb [Mountain] FFT-CSP - Large Image
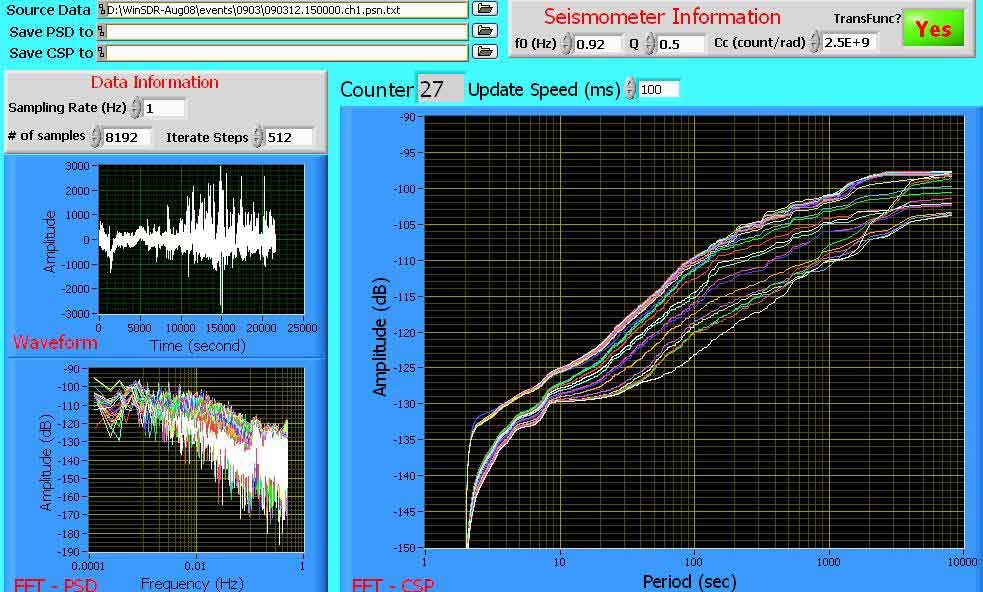
200903.12 Cobb [Mountain] - Channel 1 FFT-CSP - Large Image
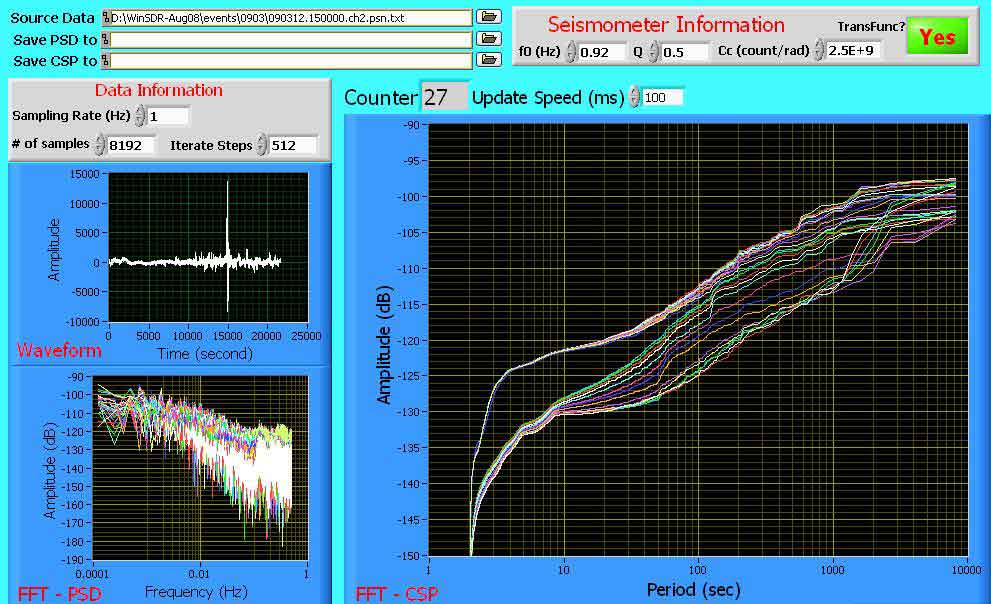
200903.12 Cobb [Mountain] - Channel 2 FFT-CSP - Large Image
[Notes: While reviewing previous VolksMeter FFT-CSP animation, I selected three PSN files dated - UTC Time - 03/06/09 15:26:45 -- 03/08/09 20:33:17 -- 03/10/09 15:39:18 [03/12/09 added later] and sent them to Randall Peters.
Randall returned the above CSP Data Displays with the following notes:
The one on 3/6/09 was based on 10 sps, but the file was so big as to nearly crash my computer. Thus the other two used 1 per s.
There are definitely some low frequency modes visible.
The hour values (16,15, and 20) correspond to near the middle of the record.
The case 16 was used instead of 15 as you wanted, because of the d.c. offset that I didn't want to try and remove. All record durations are three hours.
 -
-
Mag 6.5 Earthquake - NORTH OF SVALBARD
2009 March 06 10:50:29 UTC
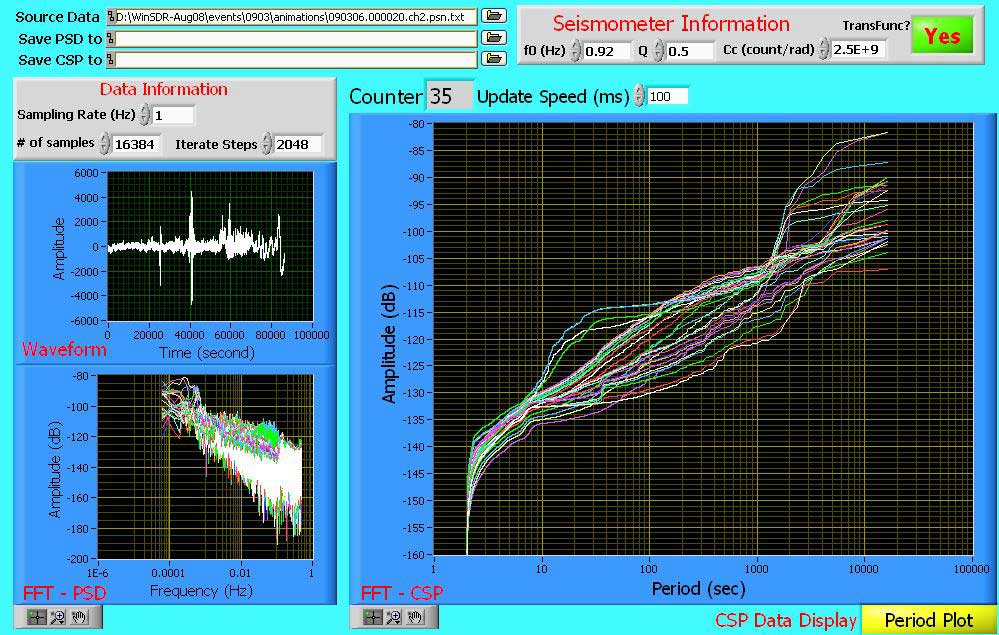
Recorded by: ARPSN - FFT-CSP Data Display - Large Image
Spectrum of Microseism 'amplitude modulation' - 17 March 2009
 PSN by Randall Peters")
Seismic Microseism Surfing - 17 March 2009
The above spectrum of microseism amplitude modulation time records are band passed at 0.137 Hz (using the most narrow possible 32-pole filter).
The 0.137 corresponds to the peak of the March 17, 2009 microseism spread, both at Cobb [Mountain], CA and Redwood City, CA.
"The 'coming and going' of microseisms at this frequency is not random, as you can see from the spectrum of the 'rectified' signal after removing the 0.137 Hz carrier ripple (using exponential smoothing).
The 25 min. and 23 min. are probably eigenmode frequencies, which suggest ocean waves responsible for the microseisms are being modulated by the Earth's free oscillations." - Randall Peters

2009 March 19 18:17:37 UTC - USGS - ARPSN
Earthquake - Magnitude 7.6 - TONGA REGION

CSP Data Display - Macon, Georgia - Large Image
![VolksMeter CSP Data Display - Cobb [Mountain], California](../images/TongaEQ-M7.6-19Mar09-Cobb-NS.jpg "VolksMeter CSP Data Display - Cobb [Mountain], California")
CSP Data Display - Cobb [Mountain], California - Large Image

PSN Event Display - N/S - Velocity/Integrated - Cobb [Mountain], California
200903.19
![Spectral Time Evolution of Tonga 7.6m Earthquake, Cobb [Mountain] CA 200903.19](../images/Tongaspectralevolution.jpg "Spectral Time Evolution of Tonga 7.6m Earthquake, Cobb [Mountain] CA 200903.19")
Spectral Time Evolution - Tonga 7.6 Mag. Earthquake, Cobb [Mountain], CA - 200903.19 - Large Image

Bombay Beach, California
Earthquake Swarm
Earthquake swarms are events where a local area experiences sequences of many earthquakes striking in a relatively short period of time. The length of time used to define the swarm itself varies, but the United States Geological Survey points out that an event may be on the order of days, weeks, or months.[1] They are differentiated from earthquakes succeeded by a series of aftershocks by the observation that no single earthquake in the sequence is obviously the main shock. Earthquake swarms are one of the events typically preceding eruptions of volcanoes.
One example is along the Cerro Prieto fault near Mexicali, BC in Mexico where over 500 quakes and aftershocks hit in February, 2008.[2] Another is a swarm that's been dubbed "The Mogul earthquake sequence" that began in February 2008 near Reno, Nevada and continued for several months, ending in November 2008.[3] Between February and April the swarm produced more than 1,000 quakes of small magnitude, although the largest measured 4.7. - From Wikipedia, the free encyclopedia
Current Swarm
March 24, 04:55 AM - March 25, 2009, 06:47 AM
http://quake.usgs.gov/recenteqs/Quakes/quakes0_fault.htm


Redoubt Volcano Latest Observations
Alaska Volcano Observatory - Ashfall advisories - RED Status
2009-03-30 02:16:26
We are re-analyzing the event reported as an explosive eruption occurring at approximately 23:14 AKDT (7:14 UTC). An episode of stronger tremor at the volcano was in progress when the seismic signal from a M5.4 earthquake near Kodiak Island passed through the Redoubt area causing the tremor amplitude to appear to increase quickly.
Earthquake - Magnitude 5.4 - KODIAK ISLAND REGION, ALASKA
http://earthquake.usgs.gov/eqcenter/recenteqsww/Quakes/ak00097662.php
2009 March 30 07:13:01 UTC
CSP Data - Macon, Georgia

Offset

Click for Large Image
Macon, Georgia E-W offset occurs 20 minutes after the arrival of surface waves from M5.4 Kodiak Is. earthquake of 30 March 2009. Total time duration = 14 hours starting at 00:00 UTC

Macon, GA CSP Data Display of Kodiak Island Region Earthquake - Large Image

Redoubt Volcano Ash Cloud from Space
Speaking of Eigenmodes
Magnitude 2.6 - SOUTH CAROLINA Earthquake
http://earthquake.usgs.gov/eqcenter/recenteqsww/Quakes/sehnw0327a.php
Recorded by Macon, Georgia
2009 March 27 16:06:25 UTC


Magnitude 4.3 Morgan Hill, CA Earthquake

Redwood City, CA PSN CSP Data Display - Heliplots - Large Image
Magnitude 4.3 Morgan Hill, CA Earthquake Continued
as seen from Redwood City, CA PSN N-S

CSP Data Display - This Special Data Is Currently Unavailable from USGS - Large Image
The higher the sample rate, the less information in the CSP about the low frequency spectral components. This is because the CSP represents, for a specified value of the period, the amount of power starting at the Nyquist period (reciprocal of one-half the sample rate) up to that period value. So I've generated the attachment, using the Redwood City, CA PSN data, but saving for the record only every 10th data point.
Notice that the 24 hour record separates into three distinct branches: (i) the group at the start of the record that is elevated at long periods (broadly distributed branch), but contains little short period power, (ii) the group during the earthquake that is elevated at the start (sharply distributed at shorter periods), and with pretty much the same broadly distributed total power during the event as at the start, and (iii) the group at the end that is sharply distributed and everywhere lower power than the previous two groups.
Magnitude 4.3 Morgan Hill, CA Earthquake Continued
as seen Cobb [Mountain], CA - ARPSN N-S
![Morgan Hill, CA Earthquake recorded by Cobb [Mountain] CA, ARPSN N-S VolksMeter](../images/MorganHillEQ-Cobb-NS.jpg "Morgan Hill, CA Earthquake recorded by Cobb [Mountain] CA, ARPSN N-S VolksMeter")
CSP Data Display - Large Image
As seen from Cobb [Mountain], CA - ARPSN E-W
![Morgan Hill, Ca Earthquake recorded by E-W Cobb [Mountain], CA, ARPSN VolksMeter](../images/MorganHillEQ-Cobb-EW.jpg "Morgan Hill, Ca Earthquake recorded by E-W Cobb [Mountain], CA, ARPSN VolksMeter")
CSP Data Display - Large Image
Magnitude 3.1 Earthquake - GEORGIA, USA
2009 April 04 20:45:32 UTC - USGS

CSP Group:
Reflections of M3.1 Georgia, USA, Earthquake
On 2009 April 04 20:45:32 UTC there was a Magnitude 3.1 Earthquake near Milledgeville, Georgia, USA, which is not far from one of our VolksMeter CSP Group members in Macon, Georgia.
We thought it might be fun to share some of the data collected by the Macon, Georgia VolksMeter IIs.
[Notes: The CSP display in terms of frequency rather than period shows more structure for locally observed events like the one near Milledgeville. - Randall Peters]
![200904.04 Georgia, USA PSN plots of Macon, GA N-S sensor [channel 2]](../images/GA-earthquake3-4Apr09.jpg "200904.04 Georgia, USA PSN plots of Macon, GA N-S sensor [channel 2]")
N-S Channel 2 - WinSDR Images - Macon, Georgia
200904.04 - M3.1 - Large Image

N-S Channel 2 - CSP Frequency Plot - Macon, Georgia
200904.04 - M3.1 - Large Image

N-S Channel 2 - CSP Period Plot - Macon, Georgia
200904.04 - M3.1 - Large Image

N-S Channel 2 - CSP Period Plot - Macon, Georgia
200904.04 - M3.1 - Large Image
[Notes: As previously indicated, to see the features of the Georgia, USA earthquake M3.1 event, one has to use 10 sps data. Moreover, the CSP 'bogs down' if the duration at that rate is too long. So I did a 50 minute record straddling the earthquake (actually two, you see a small aftershock).
What's interesting are the several steps corresponding to different (high) frequencies characterizing the event. No doubt the local geology plays a part in the enhancement of various high frequency pieces, similar to what the larger Cobb mountain plots do by resonant enhancement of lower frequencies involving teleseisms. - Randall Peters. ~@~]

N-S Correlation of Macon, GA Pier VolksMeter & Slab VolksMeter - 200904.04 - M3.1 - Large Image
[Notes: Slab and pier instruments gave nearly identical results, except that the slab response is greater. Also, there is a building 'distortion' that is part of the 'enhancement', which showed up in the CSP 10 sps record (additional step). - Randall Peters]
M6.3 Earthquake in L'Aquila, Italy - 19 Photographs
2009 April 06 01:32:42 UTC
http://www.guardian.co.uk/world/gallery/2009/apr/06/italy-natural-disasters?picture=345563942
Magnitude 6.9 - KURIL ISLANDS
2009 April 07 04:23:33 UTC - USGS
Recorded by ARPSN - E-W Velocity (Integrated) VolksMeter
![Great Circle Distance: Kuril Islands, Russia to ARPSN Cobb [Mountain], CA](../images/ku1.jpg "Great Circle Distance: Kuril Islands, Russia to ARPSN Cobb [Mountain], CA")
Great Circle Distance: Kuril Islands, Russia to ARPSN Cobb [Mountain], CA
4199.9782 Miles


Magnitude 6.9 - KURIL ISLANDS continued:

Recorded by Macon, GA Pier N-S VolksMeter - Large Image

Recorded by Macon, GA Pier E-W VolksMeter - Large Image
CSP Data Display Images for Seismologists to Ponder
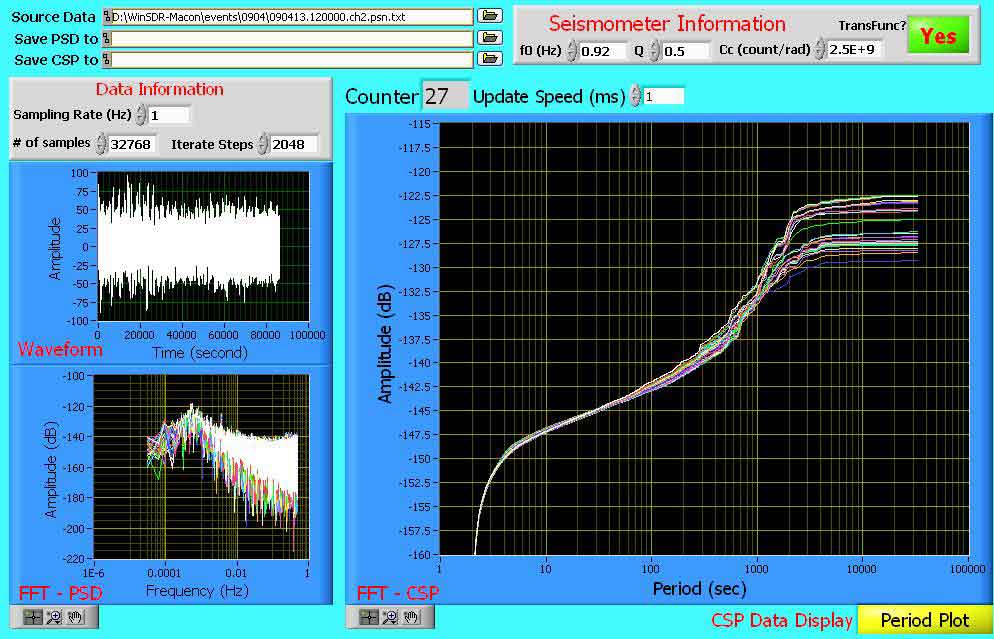
CSP Data Display - Macon, Georgia N/S - April 13, 2009 - Large Image
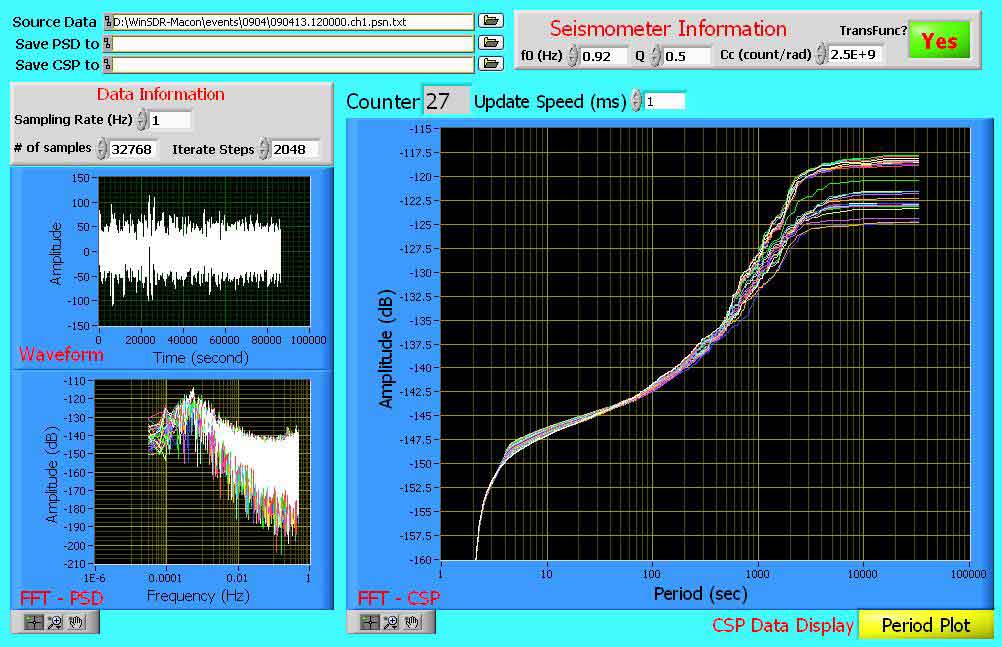
CSP Data Display - Macon, Georgia E/W - April 13, 2009 - Large Image
![Cobb [Mountain], California - N/S CSP](../images/090041212-N-S-Cobb.jpg)
CSP Data Display - Cobb [Mountain], California N/S - April 12, 2009 - Large Image
![Cobb [Mountain], California - E/W CSP](../images/090041212-E-W-Cobb.jpg)
CSP Data Display - Cobb [Mountain], California E/W - April 12, 2009 - Large Image
Magnitude 3.4 - Friday, April 17, 2009 at 8:09:39 AM (PDT)
Corrected to M 3.7 and I did not update my calculations.
The Geysers, CA -
North/South


East/West


Magnitude 7.3 - OFFSHORE HONDURAS -
2009 May 28 08:24:45 UTC
[Updated Magnitude from 7.1 to 7.3]

Magnitude 7.3 - OFFSHORE HONDURAS -
2009 May 28 08:24:45 UTC

Macon, GA FFT-CSP Plot of 7.3 Honduras Quake by Randall Peters - Large Image

Magnitude 7.3 Offshore Honduras - Recorded by ARPSN

Honduras M7.3 N/S Velocity FFT recorded by ARPSN

Honduras M7.3 E/W Velocity FFT recorded by ARPSN
Visit: 2010 Collection
![]()